Flutter Performance Profiling Before App Store Submission

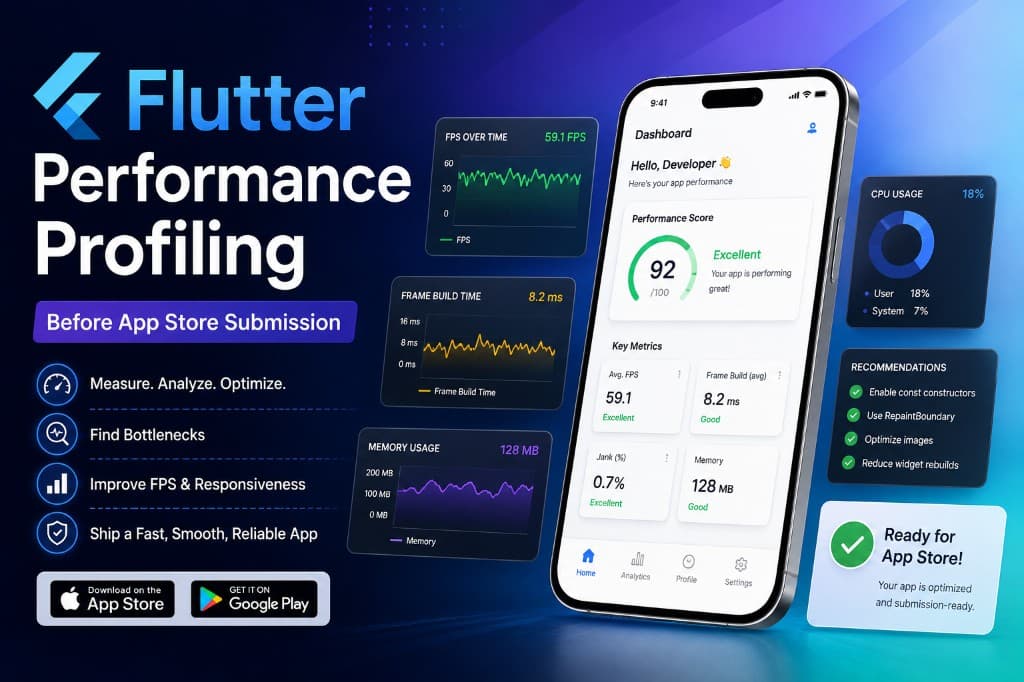
Shader jank, rebuild storms, and a practical Flutter profiling workflow before App Store or Play Store submission.
Profile on devices users own
Simulator smoothness lies. We profile on mid-tier Android hardware and older iPhones because that is where jank becomes churn. Establish a baseline scroll and navigation journey for every release candidate.
Flutter DevTools performance and CPU profilers are mandatory gates, not optional curiosities before App Store week.
Keep a one-page jank playbook in the repo. Pattern memory beats heroics the night before store submission.
Shader jank and warm-up
First-animation stutters often come from shader compilation. Impeller improved the iOS story, but you still need to exercise critical animations during startup warm-up where appropriate and avoid surprise shader-heavy effects on first paint.
Track frame build and raster times separately so you know whether the problem is layout or GPU.
Keep a one-page jank playbook in the repo. Pattern memory beats heroics the night before store submission.
Rebuild storms
Unnecessary rebuilds from broad InheritedWidgets, runaway setState, or giant build methods show up as build-phase spikes. Split widgets, use selective listeners, and prefer const constructors where they help.
RepaintBoundary can help — and can hurt if sprinkled blindly. Measure after each change.
Keep a one-page jank playbook in the repo. Pattern memory beats heroics the night before store submission.
Pre-submission workflow
Run a scripted journey: cold start, login, main list scroll, heavy detail screen, background/foreground. Fail the build on regressing jank budgets.
Keep a short playbook of past jank causes for the team. Performance culture is pattern memory, not heroics the night before release.
Keep a one-page jank playbook in the repo. Pattern memory beats heroics the night before store submission.
Test release builds under pressure
Ship with a repeatable release test rather than a final week of manual hope. Use a compact matrix of real devices, OS versions, connection profiles, and account states, then run the same critical paths on every release candidate. Watch crash-free sessions, startup time, frame timing, sync delay, and battery use after rollout; support tickets alone arrive too late. Feature flags and remote configuration can reduce blast radius, but they need a tested fallback. The best mobile release is not the most animated demo — it is the one field users can trust when conditions are inconvenient.
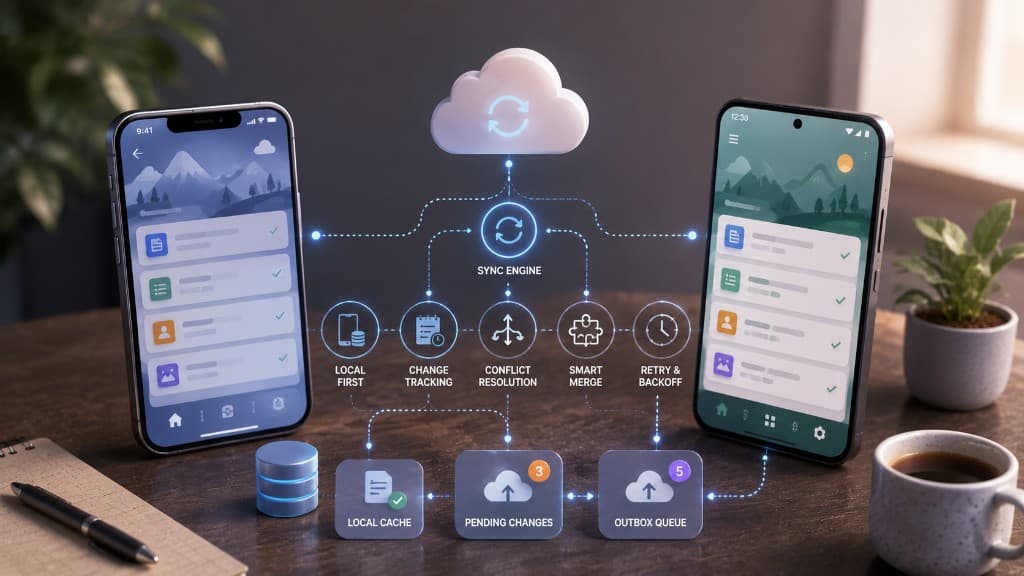
Reliable mobile experiences are designed around interruption. A user may open the app on an older device, lose a signal during a save, deny a permission, background the process, and return hours later expecting their work to remain clear. Make the domain action durable independently of the screen, expose pending and failed states honestly, and use stable identifiers so retries cannot create duplicate records. Exercise release builds on physical devices across the connection and account states that matter, including constrained networks and low-power modes. Treat performance, crash-free sessions, sync delay, and battery use as product measures after release. A staging environment with a perfect connection cannot prove this behavior. Teams earn trust by making the recovery path visible: what saved locally, what will retry, when the user needs to act, and how support can diagnose the issue without guessing.
Mobile quality also depends on communication. Give support and operations enough context to understand a device state without collecting unnecessary personal data: app version, platform version, connection class, queue state, and a correlation identifier are often enough. Keep migrations and local storage changes backward-compatible during staged rollout, because users update at different times. Make slow work cancellable where possible and do not promise a background action the operating system cannot guarantee. Review app-store feedback alongside instrumentation, then turn recurring failure patterns into a test case. These habits produce a mobile product that treats unreliable conditions as normal operating conditions, which is what users need from field, commerce, and account-management apps.
Finally, make this practice part of the normal delivery cadence rather than a document opened only during an incident or launch. Assign a clear owner, review the evidence after meaningful changes, and turn any recurring surprise into a visible test, metric, or runbook step. The right level of process is the smallest one that helps the team make a safer decision quickly. That balance keeps product momentum high while giving customers a dependable web, mobile, or integrated experience as the system and its users grow.
Keep a one-page jank playbook in the repo. Pattern memory beats heroics the night before store submission.
Fail the build on jank regressions
Codify a cold-start and scroll journey with frame-time budgets on a mid-tier Android device. Fail release candidates when budgets regress.
Flutter performance culture is pattern memory: keep a short playbook of past jank causes so the next engineer does not rediscover them the night before App Store submission.
Keep a one-page jank playbook in the repo. Pattern memory beats heroics the night before store submission.
Separate build-phase from raster-phase jank
Track frame build and raster times separately so you know whether the problem is layout or GPU. Rebuild storms and shader compilation need different fixes — measuring the wrong phase wastes the release week.
Keep a one-page jank playbook in the repo. Pattern memory beats heroics the night before store submission.
“Sustainable delivery comes from making the important trade-offs explicit, measurable, and recoverable.”
Checklist
- Physical-device release journey defined
- Offline, interruption, and retry states tested
- Stable idempotency keys used for writes
- Platform permissions and background limits reviewed
- Crash, performance, and battery signals monitored
- Fallback and support recovery path documented
Muhammad Talha Zubair
CTO & Managing Director
Owns technical direction and delivery across web, mobile, and AI integration work. Sets architecture standards and keeps product engineering close to the builders.
Let's build something
remarkable
Whether you need a web or mobile app with AI integrations, blockchain work, or a conversation about our AI products — tell us what you're building and we'll respond fast.
Blog questions
How we write, how often we publish, and how you can contribute or stay in the loop.
Blogs are written by Automative Tech’s engineering leadership — Muhammad Talha Zubair, Bilal Hassan, and Umar Khalid — based on production web, mobile, AI integration, and blockchain work.
We lead with custom web and mobile delivery with AI integrations — Next.js, React, React Native, Flutter, and LLM features. Selected posts also cover blockchain, AI products, and cloud when they support shipping real products.
A few deep pieces per month. We prioritize substance over cadence.
Yes with attribution and a link back to the original. For syndication, contact us for a simple agreement.
Occasionally, when the author has real production experience. Pitch a short outline via the contact form.
Follow the social links in the footer, or contact us to ask about engineering notes updates.